How can I check if there are interferences from the cable?
When we calibrate the sensors there is no signal bounce other than the time that the pyranometer needs to reach its final value (time constant) if however there are electrical inferences and the shielding of the cable and data logger is not good then you can expect noise. A good way of testing this is by connecting a dummy pyranometer with the same cable (length and position) to the data logger. (Dummy pyranometer is a 1 kOhm resistor) This will show any interference coming from the cable.
Negative output during nighttime measurements?

Solar radiation at the site was greater than 1400 W/m²! Is this reasonable?
What is the directional or cosine response?

What parameters or errors should we take into account if the source of light comes from a certain angle?
Can I use a pyranometer under water?

If I use a pyranometer under water, can I connect a data logger to it?
What is the calibration frequency of a pyranometer?
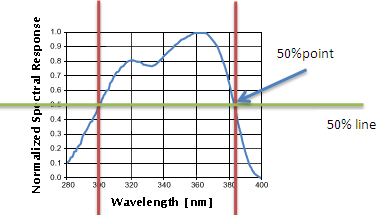
What does spectral range of 310 – 2800 nm (50% points) mean?

What is the WMO standard for the pyranometers?
What is the resolution of a pyranometer?
What is the bandwidth of a pyranometer?
In our PV application the cable from the CMP 11 (50 meters) will go along other cables that come from the PV panels in which there is a DC voltage and around 100 Amps. Will these cables affect the measurement?
Do you have filters that can be used to verify spectral distribution over the following wave lengths?
Is there a standard product that converts the pyranometer output signal to 0-5V or 0-2V?

What kind of pyranometer do you suggest for usage inside a greenhouse?

What type of pyranometer can I use for my fixed PV panels farm?

What type of pyranometer can I use for my solar concentrators farm?
Is there a Pyranometer available that has the same spectral characteristics as a PV panel?
Is it possible to connect the Pyranometers to a computer?
I would like to know what kind of output the CMP 6 Pyranometer has (analog or digital)? What voltage range do you have?
Do the pyranometers come with a calibration certificate, NIST traceable?
What does Zero Offset A mean?
Are there any accessories needed with the Pyranometer to avoid reflected radiation from the surface?
What is the big difference between CMP 11 and CMP 21?
Does a Pyranometer require any power?
Maximum and minimum irradiation quantities?
Is the pyranometer calibration affected by the length of the signal cable?
What color code is used when there is an extended cable on the NR Lite?
Sometimes it happens that the colors of the cables are different when you order extended cables. Usually there is added a page in the manual where this is mentioned.
Standard = extended
White = white
Green = blue
Black = black
Standard = extended
White = white
Green = blue
Black = black
For the CNR 1, what is the ideal constant current source for the PT-100?
What is the response time for CNR 1 sensors?
Does the CNR 2 use the same sensor as the NR Lite(2) without wind-breaking domes? Or does it have separate thermopiles for short and long wave radiation?
How come the NR Lite(2) specs refer to a continuous range between 200 and 100,000 nm, while the CNR 2 specs refer separately for the short and long wave radiation ranges?

Can I measure specific parts of the UV spectrum with the CUV 5?
No, it cannot separate UV-A from UV-B, it measures both together, for measurement of these parameters individually we recommend our UVS Series of radiometers.
What is the calibration frequency of UV radiometers?
Can a METEON data logger be connected to UVS-A-T and UVS-B-T?
What does ‘Mean Adjustment Factor’ mean on the calibration certificate of a UV radiometer?
Is there an UV-C sensor available?
Do you think this controller can cover ‘automatic temperature compensation’?
What is the bandwidth of the CUV 5 and why does this not match the UV spectrum?
What does ‘Radiation Amplification Factor’ mean?
Can the UVIATOR software operate with a Campbell logger and its software? Or, do I have to use LOGBOX-SD for compatibility with UVIATOR?
Why do I need the UVIATOR software?
What is the output range of the UVS radiometers?
Can the data from the CUV4 be used as input to calculate UV index?
Does the UVS-AB measure UV-A and UV-B at the same time?

What does DustIQ measure?
The DustIQ measures the amount of light relected by the dust back into the sensor. This is converted into Transmission Loss and Soiling Ratio. The DustIQ reports 2 independent transmission losses and soiling ratios of its 2 sensors. (Transmission loss = 100% - soiling ratio)
How does soiling loss translate into power/energy loss?
What is the accuracy of dust measurement by the DustIQ?
What can I do with the zero offset?
How closely do dust levels on sensor and PV plant panels match?
Is the Dust IQ soiling loss accurate when compared with a 2-panel system?
What is the maximum soiling measurement range of DustIQ?
What is the significance of the solar cell on the DustIQ?
What is the impact of the panel temperature on the Dust IQ?
What is the purpose of the temperature option when selecting the correct model of DustIQ?
How many DustIQs are needed relative to the installed PV plant power? (Number of sensors per 1 MW)
Is the DustIQ useful for Polycrystalline or Thin-film modules?
What is the expected soiling loss percentage with respect to dry cleaning and wet cleaning?
Can we trigger automatic movement of robotic cleaners for cleaning of modules through RS-485?
Can the soiling data be transmitted to SCADA via Wi-Fi?
Can we link in to SCADA system to measure the Performance Ratio (PR)?
Can the DustIQ resist harsh conditions, for example in locations near the sea?
Is there a way to identify the soiling rate on the glass dome of a pyranometer using the DustIQ?
What is the advantage by using blue LED light?
Why can the reported soiling ratio differ between the two sensors of the DustIQ?
Following IEC 61724-01, would you recommend measuring soiling in heavy rainy areas, e.g. Quebec in Canada?
How fast can the DustIQ report data?
The DustIQ is obviously smaller than a solar panel. By saying "it has PV panel dimensions", what does that mean?
What if the soiling buildup does not look the same on the DustIQ collection area compared to other modules?
Many PV plants are installed near the ocean or industrial areas. What do you recommend to handle bird droppings and organic material or soot?
What is the main difference between normal soiling station of other makes and DustIQ?
How does the DustIQ compare to the Atonometrics MARS sensor?
Does DustIQ work independently or for all PV technologies, i.e. Bifacial PV?
How often do I need to execute local calibration?
Is the DustIQ able to calculate loss when covered with dust different to the calibration dust sample?
Since it is needed to do calibration with natural soiling, is the data still valid before calibration?
What to do in case of a dust storm where the local dust is different?
What is the periodic time to clean the DustIQ?
How should the DustIQ itself be cleaned?
What data filtering/filters should be applied to raw data measured by the DustIQ to make the measurements useful for soiling analysis and wash decision?
We are using self-powered module cleaning robots. If we keep its frequency of say twice a week, will dust measurement sensors be required?
How and where to mount the DustIQ?


Can the DustIQ be installed on the open end of a row of panels or does it have to be supported on both sides between two panels?
Can the DustIQ be mounted horizontally rather than vertically for single roof panel arrays for commercial rooftop systems?
What is the extension of the log file of the LOGBOX SD?
The extension is .TXT or .XLS. Using the software interface you can select to save this as a text -or Excel file.
What is the format of the log file of the LOGBOX SD data logger?
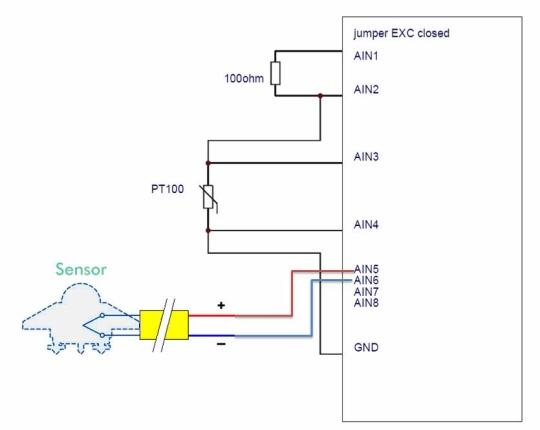
How do I connect a Pyranometer with PT100 to the LOGBOX SD Data logger?
Does the internal battery stop working when you power the Logbox SD with an external power supply? In this case, will you still have power available for excitation on the Power Out connection?
How does a data logger work?
Can I use the METEON in combination with the AMPBOX?
Can the data from the METEON be downloaded into Excel?
What is the operating life of the batteries of the METEON?
How is the METEON powered?
Can we use the METEON outside?
I have an outdoor reading of 2000 to 4000 W/m² with my METEON. This does not make sense since theoretically, readings should be less than the solar constant (1360 W/m²).
If we take an interval of 1 minute then the sum of all the averages for 1 day it says 394838 W/m². If we set it for 30 minutes, then we will get 1 average per 30 minutes so the sum of all these averages for 1 day would be 13161 W/m². What are we doing wrong?
Can I order a new filter for my CVF 4 ventilation unit?
Filters can be ordered in sets of 5.
What is the accuracy calculation from a radiometer to the input of the AMPBOX? And the accuracy calculation out of the AMPBOX?
What does “gain range” mean in the AMPBOX specification? And how is this value useful?
In the AMPBOX specification what does “Zero adjust” mean? And how is this value useful?
What is the benefit of using a ventilation unit?
The ventilation unit has a 5 W and 10 W heater. When do I need 5 W and when do I need 10 W?
Can I convert the current output (mA) of an AMPBOX to Volt?

The AMPBOX has a range of range 0 - 1600 W/m2 for 4-20mA. The CMP 3 pyranometer has a sensitivity of 16,51 μV/W/m². And the PQS 1 PAR quantum sensor has a sensitivity of 5,59 μV/μmol/m²s. How can we calculate the output signal?
Can we measure low level photosynthesis radiation (0,1 μmol/m²s) with the PQS 1 and the AMPBOX?
Can I use a METEON data logger in combination with the AMPBOX?
Each AMPBOX corresponds to a specific pyranometer, could you please specify this?